Can
Mankind Really Expect To Tame Earth's Climate Simply by Limiting CO2
Releases
To Remove It From Cosmic Control?
By Joel M Williams (text and images ©2015)
A
free pdf version of this paper is available at the General Science Journal
(click here)
Claim (click to
view): "A whopping 97 percent of all
scientists agree that human activity is causing our climate to change ...... but
only 40 percent of all Americans believe this because of "pseudo
scientists" and special interests". (An evaluation of the 97% claim is
presented in the SUMMARY.)
When it comes to global thermal changes, mankind has NOT been a major factor,
except maybe since the industrial revolution started in the mid-1700s AD. While
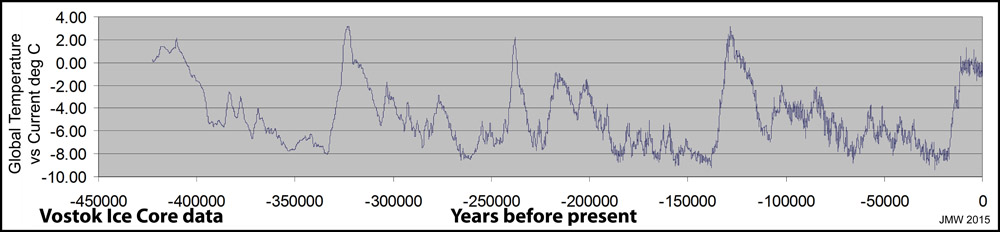
global thermal data for distant past is difficult to obtain, the Vostok
Antarctic Ice Core data#1
at least provides a view of the past 422,800 years. The Vostok Antarctic Ice
core data was sorted into 4228 100-year bins which were then averaged. Where
there was no datum in a bin, the bin was visually interpolated from the data in
adjacent bins. The resulting data distribution is shown in the figure
below.
Mankind's "free roaming range" during these global thermal cycles is presented in a
YouTube
2min 54sec video (click to view). Info on the generation of this video is presented in
"The
Molding of Mankind - Planet Earth in a Thermal Vise" (click to
download).
The figure below shows smooth curves through the percentage of the thermal data that falls into 11, evenly divided, thermal portion for each high-to-high temperature cycle (~100,000-year) of the Vostok data. The dashed blue line show the average % of global temperature levels of all four cycles.
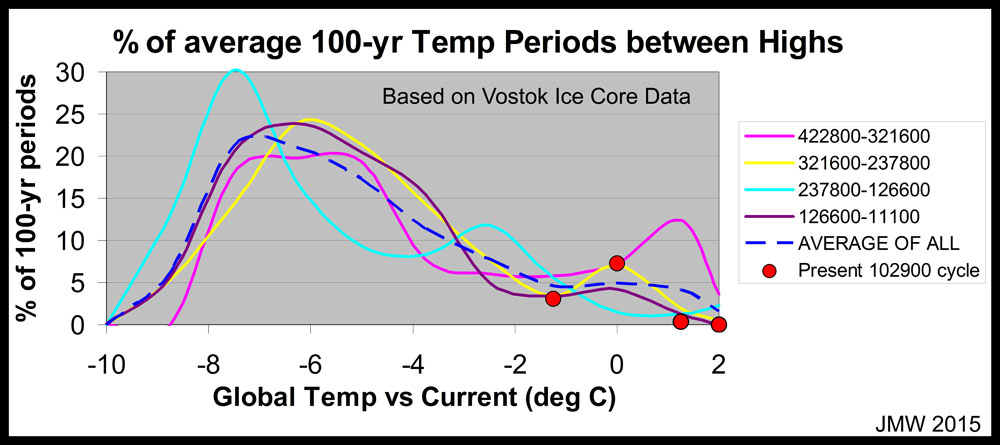
Where are we in the global thermal vise? The last 11,400 years have consumed almost all of the warm temperatures for the next cycle - the red dots in the figure. With 89% of the current ~100,000-year cycle remaining, global temperatures will get colder and downright raw at the cycle's perigee (~ - 8°C relative to the current global temperature). The global thermal clamp will continually put more restrictions on agricultural crop (food) production. Concern about global warming is interesting in that human activity of the "global warming" nature will actually prolong the current thermal period! As crop production diminishes, so will the world's population. Energy to keep the remainder warm will decrease simply because there will be fewer people to supply it AND maintain its distribution! Lodging will deteriorate. What will last through the next perigee? In a 100,000 years, WE will be the "ancient aliens" that currently get TV hype! How do the proponents of climate control plan to get mankind to the next warm spell - about 100,000 years from now? Mankind needs to be thinking about how to feed and heat itself for a 100,000 years of cold climate. Droughts, etc now are minor compared to what mankind will face down the road.
The short-term (a decade or two ahead?) climate changes are what "scientific" folks are focusing on.
Cleaning up the environment to make life livable is one thing: for example, cleaning up the air in steel mill towns and that emitted from uncontrolled, coal-fired, electricity generating stations and the water in streams in mining areas, etc., etc. Controlling the climate of the earth is a bit "bigger" task! And, as John Bartlit of NM Citizens for Clean Air and Water has pointed out in
"Value
Variable Weather" (click to access), who gets the favorable climate at the expense of the rest?
Current global temperatures are relatively constant and "mild" compared to the long-term trend. Ice caps are responding to calories already deposited to oceans.
It takes a while for massive chunks of ice to respond to warmer waters - think about ice cubes in water and about how cold that water eventually gets when those ice cubes are turned to
water.
What I see is that the advocates of humans making global temperatures unacceptably warmer are NOT looking at the long-term, but rather at the short--term. A question: Is the green-house effect of
CO2 countering a natural cooling that the earth might already have begun to experience and thus is giving mankind some "extra" warm years?
"A
Look On the Brighter Side of Global Warming" (click to view)
highlights some of the presentations given in the conference held in Santa Fe in
May 2015. Knowing how to create some warmth may be to mankind's benefit! For how long, however?
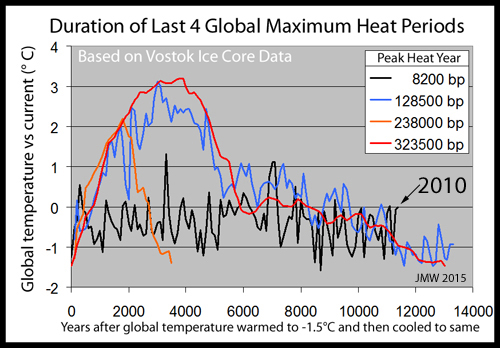
The figure below gives a view of how the current global "heat wave" compares to the previous three. The duration periods of the past 3 and the current global periods of temperatures are started, for the comparison, 1.5°C below the current level and continue until they drop back to that level. The rise is rapid (roughly 2C/500-years), whereas the fall during the last half of the cycle is slow (roughly minus 2C/6000-years). Based on the two broad heat periods, we are nearing the end of our current warm period.
The data clearly shows that the current "heat wave" is
far "milder" than the others in the last 400,000 years!
Readers might want to acquaint themselves with the broad picture as well as short-term "pitches" of "Global Warming" alarm. Mankind's recorded history only covers a few millennia and the temperature changes during this period have been minor compared to those over a millennia of millennia! By and large, we think about today, tomorrow, next week and maybe some decades into the
future and do not worry about many generations to follow us.
Even if mankind can dramatically manage climate behavior during our current, "relatively smooth", warm period, what are the prospects of taming the "extreme" periods - namely, extremely long Big Chills? What technologies should mankind be working on to sustain even a modest population level during the major part of the next 100,000-year cycle? What will induce mankind to act? And when?
Can corn and wheat be modified to grow productively at very low
temperatures at which they hardly do so now?
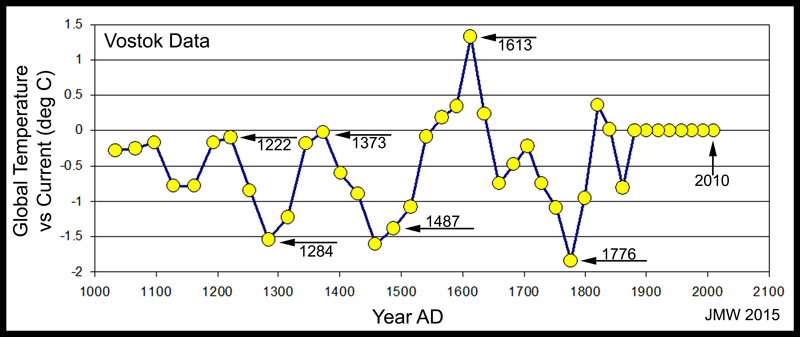
Advocates for an urgent need to control the climate might claim that the trend in recent years is sharply upward and thus more critical than expected from my graphs that represents changes for centuries. Consider the global thermal temperatures for the last 1000 years that are presented in the
figure below. Columbus sailed the seas to "the new world" as global temperatures rose in 1492; Washington's troops had a cold 1777 at Valley Forge. Interestingly, the reported Vostok core
data#1 indicates that global temperatures have been fairly constant over the past century! Strange? A problem analyzing the topmost layers? One would have expected more
variation - this is partially addressed in the ADDENDUM further
down the page.
Do current models, such as the "Global Change Assessment Model"#2 , which makes 5-year predictions from 1990-2095 for "global mean temperature rise" (note rise, not change),
precisely match the past 400,000 years of global temperature changes on a
century-level? If these models do not generate the observed, century-average behaviors precisely, their accuracy in making yearly, 5-year or decade predictions are suspect. What does the comment#3 that the
"discrepancy between models and actual temperatures in the last 10 years have been resolved ........ It isn’t warming quite as fast as the model said ....... because of a countervailing (cooling) ocean cycle" say about such modeling? Remember "ice-cubes-in-water"? Takes quite a while for the oceans to warm enough to break off gigantic chunks of ice from the polar regions. But after the oceans begin to cool, .................
(See the ADDENDUM below for how well these models are predicting global mean
temperatures.)
Summary
I assume that I would be included among "the
scientists". I spent a number of years studying environment pollution
related to coal and uranium wastes for EPA and DOE at the Los Alamos National
Laboratory. I might be included with the "97%" that say mankind is
causing "our climate to change" - depending on how the questions are
phrased. When the American Meteorological Society did a survey and specifically
asked "Is man the dominate controller of climate over the last 50
years?", the response was only 52% "yes".#4
Christy#5,
others and I would now be in the negative half. I suspect that "climate
change" and "environmental pollution" are not very well
delineated. Air pollution that extends 10s of thousands of feet upwards is hard
to miss. I went through Gary, IN, back in the 1960s when the sky was bright
orange and the sun set well before it went below the horizon. Media often show
citizens of Beijing wearing masks because of the extremely poor air quality.
Citizens of Beijing would very likely say that "human activity" is
changing their "climate". These are examples of mankind's polluting
the environment and not of global climate changes per se. The greenhouse effect
of CO2 generated by massive levels of coal and petroleum combustion
to produce electricity makes common scientific sense. It is the magnitude of the
effect of such pollutions on a global scale and the non-human effects that are
the issues. Having delved into the matter, it is not clear that we are destined
for a 2°C rise over the current global level when the natural repetitive cycle
should be in the declining stage of a 100-century thermal cycle. One might ask
this question: what would the average global temperature be "right
now" if all of the CO2 generated by mankind in the last 300
years were "instantaneously" removed from the atmosphere? The answer might
be chillier! There is NO DENYING that human activities are polluting the
environment! Pollution IS something mankind can moderate! Global climate control
is something else!
ADDENDUM
The figure below is from John Christy of the University of Alabama - Huntsville.#6 A version of this plot with only the average of the computer outputs and the actual observations was presented by him on May 13, 2015 to a congressional committee.#7 [An earlier version is included in a University of Arizona atmo336 course lecture#8, which is a good read on modeling and variables (Click to access).] The error bar for the observed data is ~±0.08ºC.#6 Note that the measured global temperature has been nearly "flat-lined", within data error, for the past decade. Christy's figure highlights that almost every model - 32 were evaluated - makes predictions that greatly deviated from actual observations for the past two decades with the extrapolated divergences becoming greater with time! It is clear that all of the models, except Russian INM-CM4 (marker added by JMW), have been going off on a tangent since 1995! If CO2 has an effect as great as these models would indicate, then the models are greatly underestimating something with an equalizing opposite effect. As pointed out earlier, if observed data is NOT precisely modeled within their error bars, then the predictions of the model, even into the next decade, must be viewed with a great deal of consternation!

The "greenhouse effect of CO2"
is a major component of the models. CO2 is released from ocean water
as global temperature increases - physical chemistry. Since landmass surfaces
warm faster than circulating ocean water, CO2 releases will lag
overall global temperature rise. CO2 atmospheric levels rise even
without human intervention. Mankind's adding extra CO2, as it is
doing now, does not necessarily mean that the global temperature, which is
strongly cosmically controlled, will dramatically increase. CO2
return to colder ocean water is slow - diffusion controlled at the surface layer
- and will lag the global temperature decrease as the oceans cool slower than
landmass surfaces. Unabsorbed CO2 will keep the level higher for the
next "heat wave".
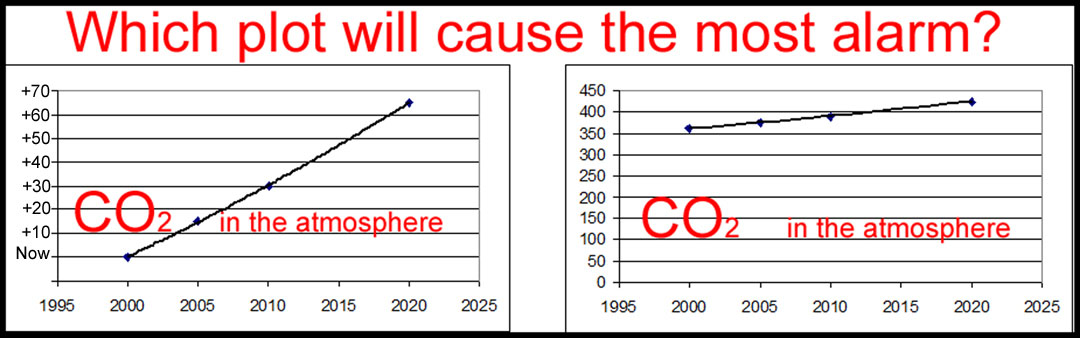
The models emphasize what they would predict on a very short time scale (35 years) with a reference to "1980" as the baseline. Significant ups and downs in global temperatures on a decade scale without massive human contributions to atmospheric CO2 levels are clearly evident in the Vostok ice core data. Future CO2 levels are said to be of considerable concern. The graph on the left of the figure below emphasizes a steep increase relative to the level in 2000AD. Exponential projections are often presented beyond this time period. But even 5 years from now, at 2020, the rise in CO2 levels looks dire. When the same data is plotted on a total CO2 level scale (graph on the right of the figure), an increase in CO2 level is still apparent, but the increase hardly suggests the same alarm.
As noted earlier, the global temperatures over the past millennium have been mild and relatively constant compared to those of the other "heat waves" of the past 400,000 years. To put things in perspective, I have placed the last 35 years of satellite-derived global temperatures from Christy's plot on a scale with the Vostok ice core data for the past 300 years - the red data in the white box in the figure below. For further couching of the past 35 years of observed data, the mean global temperature for the last millennium and its sigma spreads [1 sigma (68% of the data), 2 sigma (95%) and 3 sigma (99.7%)] are demarcated.
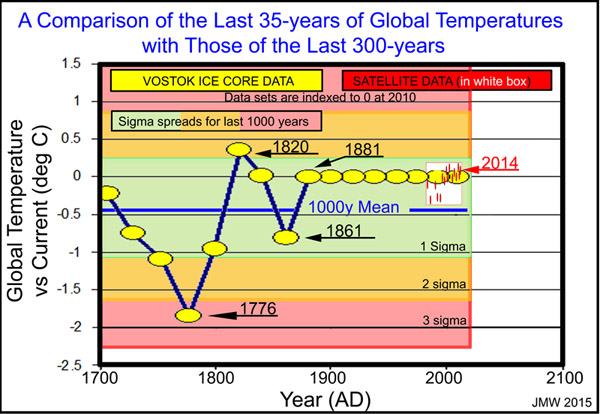
Some information that can be gathered from this figure:
Climate change and droughts are VERY SERIOUS stuff for countries and regions that are adversely affected; esp, those with extensive agricultural activities. Forces that oppose any CO2 effect to keep the global temperature constant will still be there, even if CO2 emissions are reduced.
People tend to forget that decade-long droughts are fairly common and have occurred throughout documentable history. Have a look at the US National Oceanic and Atmospheric Administration's own website entitled "North American Drought: A Paleo Perspective"#9 (Click to access). Current CO2 levels were NOT the cause of past droughts! Since Planet earth is cosmically controlled and the oceans and atmosphere are fluid, LONG-TERM CLIMATE CONDITIONS ARE NOT CONSTANT.
References
1 The data available from CDIAC represent a major effort by researchers from France, Russia, and the USA; Jouzel and others in these refs - Nature 329:403-8 (1987), Nature 364:407-12 (1993), Nature 399: 429-436 (1999) and Climate Dynamics 12:513-521 (1996); http://cdiac.ornl.gov/ftp/trends/temp/vostok/vostok.1999.temp.dat
2 Climate Change, http://www.epa.gov/climatechange/EPAactivities/economics/modeling.html
3 Keller, C., in "A Look On The Brighter Side Of Global Warming", http://www.ladailypost.com/content/look-brighter-side-global-warming4
Stenhouse, N, etal, "Meterologists'
Views About Global Warming",
http://journals.ametsoc.org/doi/pdf/10.1175/BAMS-D-13-00091.1;
Taylor, J, "The Latest Meteorologist
Survey Destroys The Global Warming Climate 'Consensus'",
http://www.forbes.com/sites/jamestaylor/2013/11/20/the-latest-meteorologist-survey-destroys-the-global-warming-climate-consensus/
5 Gattis, P, "7 questions with John Christy and Roy Spencer: Climate change skeptics for 25 years", http://www.al.com/news/huntsville/index.ssf/2015/04/7_questions_with_john_christy.html
6 Christy, John, Private communication - May 2015.
7 Gattis, P, Climate expert John Christy: U.S. emission cuts won't make difference, http://www.al.com/news/huntsville/index.ssf/2015/05/climate_expert_john_christy_us.html
8 "Climate Models' Predictions of Global Temperature Change", a lecture in the U of Arizona atmo366 course; http://www.atmo.arizona.edu/students/courselinks/fall14/atmo336/lectures/sec6/change.html
9 "North American Drought: A Paleo Perspective", https://www.ncdc.noaa.gov/paleo/drought/drght_history.html